Can Maple used for Image Processing?
Maple is the tool for solving mathematical problems and creating interactive technical applications. My experience with Maple is that --> a symbolic software.
However, when I did a search on "maple image processing", I found the following link:
Image Processing with Maple
Seems like the new version of Maple (or even older version) support basic image processing function, and it might be supporting more and more in the future...
Some other software for image processing could be found at the sidebar, or you can simply do a search using google or yahoo..
Keyword to search for : Matlab, Maple, Mathematica, Math Software, Image Processing Software, Image Analysis...
Which Software to Use?
What Software Should be Used for Image Processing?
There are numbers of different software for engineering, each has its' capability and weakness. Most of the examples here use Matlab because I deal alot with Matlab in University.
However, I won't say there are no other software better than Matlab, but i still believe:-
"Choose the Software you're familiar with, know your direction and how far the software can accompany you along the way..."
A good article comparing 3 famous software:
3Ms for Instruction: Reviews of Maple, Mathematica, and Matlab
Happy programming.
Drawing Circles Around Round Object
Drawing shapes to highlight certain objects could be done in several ways. Previous examples illustrate few ways of drawing object by overwriting pixel value as well as by adding a "patch" on top of an image. This example shows how to draw circles around a round object just simply using "plot" command
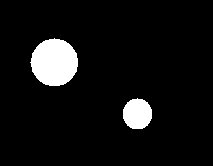
1. Original image
S = imread('pic13.jpg');
S = im2bw(S);
S2 = ~S;
imshow(S2);
2. Extracting required objects' properties. Required properties are centroid and the area of the round objects. The area property is used to compute the radius of the object.
S3 = bwlabel(S2);
S4 = regionprops(S3,'Centroid','area');
R = sqrt(S4(1).Area/pi);
h = S4(1).Centroid(1);
k = S4(1).Centroid(2);
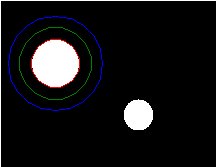
3. Drawing circles around 1st object with different radius by refering to the radius of the object.
ratio = [2 1.5 1];
nR = round(R*ratio);
t = 0:pi/20:2*pi;
x1 = (h+nR'*cos(t))';
y1 = (k+nR'*sin(t))';
hold on;
plot(x1,y1);
1. Original image
S = imread('pic13.jpg');
S = im2bw(S);
S2 = ~S;
imshow(S2);

2. Extracting required objects' properties. Required properties are centroid and the area of the round objects. The area property is used to compute the radius of the object.
S3 = bwlabel(S2);
S4 = regionprops(S3,'Centroid','area');
R = sqrt(S4(1).Area/pi);
h = S4(1).Centroid(1);
k = S4(1).Centroid(2);
3. Drawing circles around 1st object with different radius by refering to the radius of the object.
ratio = [2 1.5 1];
nR = round(R*ratio);
t = 0:pi/20:2*pi;
x1 = (h+nR'*cos(t))';
y1 = (k+nR'*sin(t))';
hold on;
plot(x1,y1);

Drawing Transparent Object
In one of the previous post (Drawing Shapes by Overwriting Pixel Value), a method of drawing transparent object had been illustrated using "Overwriting Pixel Value" technique. In this example, another method will be introduced without overwriting pivel value, but drawing a "Patch" on top of the image.
1. Original image
S = imread('pic12.jpg');
S = im2bw(S);
S2 = S;
imshow(S2);
2. Define transparent object properties
transparency = 0.5;
facecolor = [0 1 0];
edgecolor = [0 1 0];
3. Creating and drawing transparent object
x = [0 20 20 0];
y = [0 0 20 20];
z = [1 1 1 1];
tcolor(1,1,1:3) = facecolor;
h = patch(x,y,z,tcolor,'FaceAlpha',transparency,'edgecolor',edgecolor);
4. To move the object, simply set the "Xdata" and "Ydata" of the object without deleting current object and redrawing a new onject
set(h,'Xdata',x+20);
set(h,'Ydata',y+20);
1. Original image
S = imread('pic12.jpg');
S = im2bw(S);
S2 = S;
imshow(S2);

2. Define transparent object properties
transparency = 0.5;
facecolor = [0 1 0];
edgecolor = [0 1 0];
3. Creating and drawing transparent object
x = [0 20 20 0];
y = [0 0 20 20];
z = [1 1 1 1];
tcolor(1,1,1:3) = facecolor;
h = patch(x,y,z,tcolor,'FaceAlpha',transparency,'edgecolor',edgecolor);
4. To move the object, simply set the "Xdata" and "Ydata" of the object without deleting current object and redrawing a new onject
set(h,'Xdata',x+20);
set(h,'Ydata',y+20);

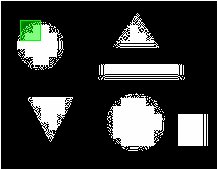
Detecting Objects' Shape(III) : Triangle Object
This example illustrates a simple method in detecting triangle object. This method is slightly different from the methods used for round object and square object detection in which the area and the perimeter of the objects are used to calculate the "score" of similarity. Instead, this method uses the "extrema" points of an object to determine whether the object is triangle.
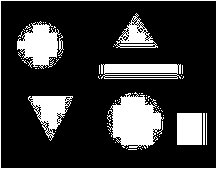
1. Original image and the negative image (value 0 represent background while 1 represents object).
S = imread('pic11.jpg');
S = im2bw(S);
S2 = ~S;
imshow(S2);
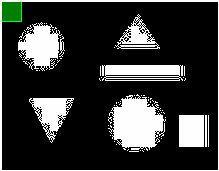
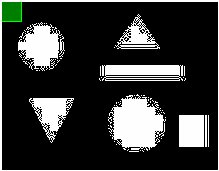
2. Labeling the objects in the image. The advance programming language will support this function and label the objects.
S3 = bwlabel(S2);
imshow(S3,[]);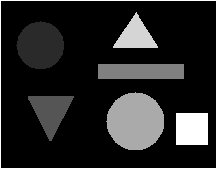
3. In this example of triangle object detection, only one object property is extracted --> "Extrema".
S4 = regionprops(S3,'Extrema','Centroid');
The “Centriod” is just used for labeling purpose. Following figure shows what “Extrema” of an object is: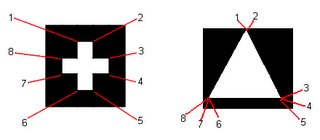 4. Ideally, a triangle will only have 3 extrema points. However, due to the imperfection of a binary object, a few of close-by points might exist instead of one.
For example eight extrema points of a triangle are: (135.5,11.5),(136.5,11.5),(157.5,45.5),(157.5,47.5),(157.5,47.5),(112.5,4 7.5),(112.5,47.5),(112.5,45.5) first 2 points are referring to the upper corner of the triangle but the values are different. This applied to point 3 to 5 and points 6-8 too.
In order to solve this problem, we need to cluster the points to their group based on the location of the points. Different ways could be used for clustering but since our topic is about image processing, image processing method will be used to group the similar points together.
In this method, a morphology technique --> dilation will be used. Firstly, the extrema points will be used to construct an image. The coordinates of the extrema points will be converted to points in an image. Let's look into one of the object for illustration:
a. Create morphological structuring element.
se = strel('disk',5);
b. Round the extrema points for 5th object (pixel value must be integer)
temp = round(S4(5).Extrema);
c. Remap the coordinates by referring to the minimum values of x and y
temp(:,1) = temp(:,1) - min(temp(:,1)) + 1;
temp(:,2) = temp(:,2) - min(temp(:,2)) + 1;
d. Create a zero matrix (black image)
mask = zeros(max(temp(:,1)),max(temp(:,2)));
e. Convert the coordinates to "objects" in the black image
for cnt2 = 1:8
mask(temp(cnt2,1),temp(cnt2,2))=1;
end
imagesc(mask);
f. Do note that some of the points are close together; use the image dilation technique to group close-by points.
mask2 = imdilate(mask,se);
imagesc(mask2);
g. Count number of real extrema points in the image
[labeled,numObjects] = bwlabel(mask2,8);
disp(numObjects);
3
5. The following codes perform calculation for all objects
se = strel('disk',5);
for cnt = 1:length(S4)
temp = round(S4(cnt).Extrema);
temp(:,1) = temp(:,1) - min(temp(:,1)) + 1;
temp(:,2) = temp(:,2) - min(temp(:,2)) + 1;
mask = zeros(max(temp(:,1)),max(temp(:,2)));
for cnt2 = 1:8
mask(temp(cnt2,1),temp(cnt2,2))=1;
end
mask2 = imdilate(mask,se);
[labeled,numObjects(cnt)] = bwlabel(mask2,8);
end
disp(numObjects);
5 3 4 6 3 4
score = (numObjects == 3);
6. Display the result visually
imshow(S2)
for cnt = 1:length(S4)
text(S4(cnt).Centroid(1),S4(cnt).Centroid(2),num2str(score(cnt)),'color','red');
end
Subscribe to:
Posts (Atom)