Object Detection using Hough Transform (II)

In previous post we've compare the Hough Matrix of a single dot, 2 dots and a single line. In this post, we'll look into more shapes:

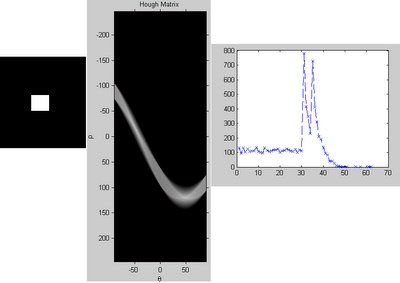
a. Square Object


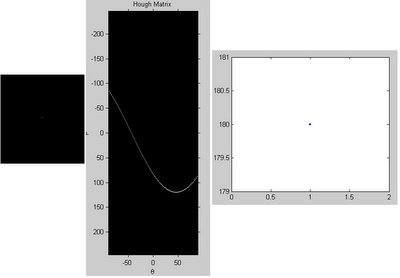
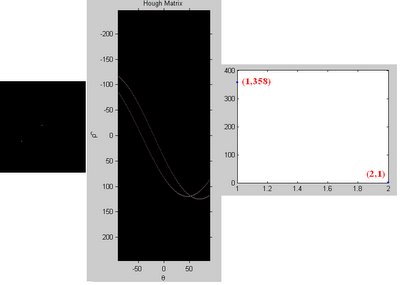
The right hand plot shows the frequencies of an intensity occurs in the Hough Matrix. It can also interpreted as: Number of lines that cross the number of points shown in the x-axis. For e.g.: for a dot, number of lines that cross one point is 180, for 2 dots image, number of lines that cross one point is 358, while number of lines that cross 2 points are 1. (refer to previous post)

For a square object, numbers of lines that cross 1 point, 2 points.....until n points in which n is the lenght of the square (approximately) would be almost the same. This could be noticed in the right figure.

b. Round Object

For a round object, numbers of lines that cross 1 point, 2 points.....until n points in which n is the diameter of the round object (approximately) would be increase in exponently. This could be noticed in the right figure.

Well, there are much more information we could get from the Hough Matrix, and what I written here might be wrong in someway, so try it out by using different images with 1 dot, 2 dots, 3 dots... using the code provided in the previous post, you would find more and more useful information from the plots!
Object Detection using Hough Transform (I)

Hough Transform convert the binary image from x-y plane to rho-theta plane. This series of examples are going to show some properties that we can observe from the hough matrix and classify some simple object shapes based on it. For more information on the Hough Transform, you can use any searh engine such as google or yahoo to searh for the keyword: "Hough Transform".

1. Original image and convert to binary image
S = imread('img1.bmp');
S = im2bw(S);
imshow(S);

2. Perform Hough Transform and show the result
[H, theta,rho]=hough(S);
figure;
imshow(H,[],'xdata',theta,'ydata',rho);
xlabel('\theta'),ylabel('\rho')
axis on, axis normal;
title('Hough Matrix');

3. Count the "frequency" of the intensity of the Hough Matrix.
clear data;
for cnt = 1:max(max(H))
data(cnt) = sum(sum(H == cnt));
end
figure;
plot(data,'.');

The codes are applied to different images to compare the differences of
the Hough Matrix on different objects' shapes.

Some simple objects' shape and their Hough Matrix are as follow:

a. Single Point


To obtain the Hough Transform, draw lines from -90 to 90 degree that cross the dot, follow by drawing a Perpendicular line from the upper left of the image to the line, and measure the lenght(rho) and the angle (theta) of the Perpendicular line.

The "hough" function will perform this for every 1 degree, and hence, for a single dot, the there will be 180 of '1' in the "Hough Matrix".

b. Two Points

When there are two points on an image, the Hough Matrix consist of 2 lines, and interect at a point which is a line that link the 2 points together in x-y plane (left figure).

Since there is only one intersection (only one line that link 2 points together), the frequencies of '1' in Hough Matrix is 358, while the frequencies of '2' is 1 in the Hough Matrix. (the '1' and '2' indicates how many time a rho-theta appear in the Hough Matrix)

c. Line

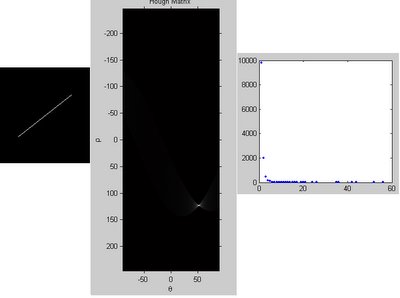
A line consists of numbers of points, ideally (the line is 45 degree) the intersection in the Hough Matrix will have the intensity same as the line lenght.

Hough Transform always used to detect lines in a real image, in which the edges always distorted. A higher value in the Hough Matrix indicates the higher possibility of the existence of a straight line.

More objects shapes will be shown in the next post...

Maple for Image Processing?

Can Maple used for Image Processing?

Maple is the tool for solving mathematical problems and creating interactive technical applications. My experience with Maple is that --> a symbolic software.

However, when I did a search on "maple image processing", I found the following link:
Image Processing with Maple

Seems like the new version of Maple (or even older version) support basic image processing function, and it might be supporting more and more in the future...

Some other software for image processing could be found at the sidebar, or you can simply do a search using google or yahoo..


Keyword to search for : Matlab, Maple, Mathematica, Math Software, Image Processing Software, Image Analysis...

Which Software to Use?

What Software Should be Used for Image Processing?

There are numbers of different software for engineering, each has its' capability and weakness. Most of the examples here use Matlab because I deal alot with Matlab in University.

However, I won't say there are no other software better than Matlab, but i still believe:-

"Choose the Software you're familiar with, know your direction and how far the software can accompany you along the way..."

A good article comparing 3 famous software:

3Ms for Instruction: Reviews of Maple, Mathematica, and Matlab

Happy programming.

Drawing Circles Around Round Object

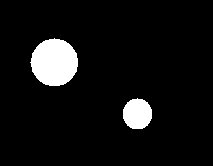
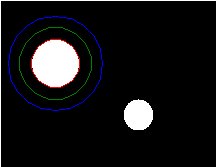
Drawing shapes to highlight certain objects could be done in several ways. Previous examples illustrate few ways of drawing object by overwriting pixel value as well as by adding a "patch" on top of an image. This example shows how to draw circles around a round object just simply using "plot" command

1. Original image

S = imread('pic13.jpg');
S = im2bw(S);
S2 = ~S;
imshow(S2);


2. Extracting required objects' properties. Required properties are centroid and the area of the round objects. The area property is used to compute the radius of the object.

S3 = bwlabel(S2);
S4 = regionprops(S3,'Centroid','area');
R = sqrt(S4(1).Area/pi);
h = S4(1).Centroid(1);
k = S4(1).Centroid(2);

3. Drawing circles around 1st object with different radius by refering to the radius of the object.

ratio = [2 1.5 1];
nR = round(R*ratio);
t = 0:pi/20:2*pi;
x1 = (h+nR'*cos(t))';
y1 = (k+nR'*sin(t))';
hold on;
plot(x1,y1);