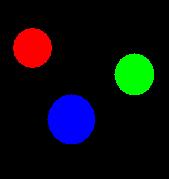
1. Reading image and comparing 2 images side by side
clear all;clc;
Ia = imread('pic23a.jpg');
Ib = imread('pic23b.jpg');
subplot(121);imshow(Ia);
subplot(122);imshow(Ib);

2. Finding the location of green object in 2 images
a. Set the threshold value for green color

p/s: I can't make the "&" appear in text, so the text aboved is in image format.
b. Find the location of the green object
[y1,x1] = find(Ia_green==1);
[y2,x2] = find(Ib_green==1);
c. Find the centroid of the green object
x1 = round(mean(x1));
y1 = round(mean(y1));
x2 = round(mean(x2));
y2 = round(mean(y2));
3. Putting 2 images together and show the movement of the objects
figure;
imshow(Ia); hold on;
imshow(Ib);
alpha(.5);
plot(x1,y1,'r*');
plot(x2,y2,'ro');
plot([x1,x2],[y1,y2]);
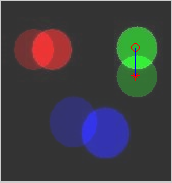
The '*' indicates the start point of the object while the 'o' is the stop point of the object. Other objects' movement could be found by modifying the step number 2.