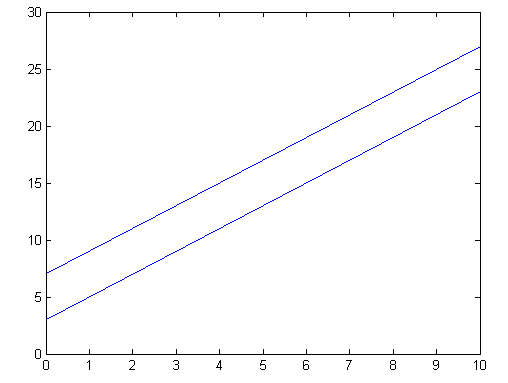
1. Assuming we have two lines on a plot
x1 = 0:10;
y1 = 2*x+3;
y2 = 2*x+7;
plot(x,y1);
hold on;
plot(x,y2);
2. One of the simple way to fill the are between 2 lines is:
a. Find 4 points for the 2 lines - start point and end point, assuming 2 lines are within certain boundary, so the x vector will be (do note that the points must be defined in order, either clock-wise or anti clock-wise):
x = [0 10 10 0];
b. Replacing x in to y1 and y2 to get y vector:
y = [3 23 27 7];
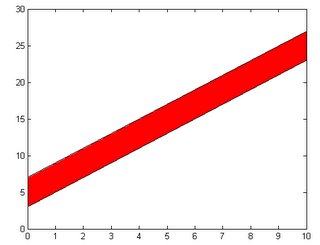
3. Use the "fill" or "patch" function to fill the area between 2 lines.
patch(x,y,'r')